

The typical means of calibrating the security of your network is to scan it using a vulnerability scanner, or to commission a network penetration test (P/T). Both activities identify vulnerabilities that represent security risk to the network and the assets it is protecting. It can be very confusing to look at a long list of findings produced by a scanner or P/T engagement and try to define a remediation strategy. This article describes a method to aggregate such findings into a single metric for devices (i.e. nodes) and for entire networks. The ability to document and communicate the security status of devices and networks as a single value has profound implications for managing the process of ongoing improvement and strengthening cybersecurity posture.
Rating the Severity of Findings: The CVSS
The Common Vulnerability Scoring System was designed to provide a standard and objective way to rate the severity of cybersecurity vulnerabilities. In essence, it accounts for the difficulty or ease of exploitation, as well as the potential consequences of successful exploitation.
There have been two popular versions of CVSS, version 2 and version 3, and both produce a numeric severity rating between 0.0 and 10.0 (inclusive) that expresses the relative risk associated with the given vulnerability. The CVSSv3 rating scale is:
- 0.0 No Risk
- 0.1 – 3.9 Low Risk
- 4.0 – 6.9 Medium Risk
- 7.0 – 8.9 High
- 9.0 – 10.0 Critical
The challenge of a security manager is to make sense out of what can be a very lengthy list of vulnerabilities with severity ratings across the entire range. Since the vulnerabilities are ranked by increasing risk, it is usually the case that vulnerabilities should be remediated in descending order, and this is one of the strengths of the scoring system.
The Challenge: Aggregating CVSS Scores

Despite the strengths of the CVSS approach, it is not obvious how to aggregate the set of vulnerabilities associated with a device into a single metric that captures the security risk level of the full set of findings. This means that it is difficult to compare the scan or P/T results of multiple devices. This in turn means that it is difficult to strategically plan network-wide (multi-device) remediation and track progress in risk reduction.
We seek a means to calculate an aggregate score per device that can meaningfully capture the comprehensive security risk represented by a set of CVSS scores and be used to track progress in risk reduction.
Ideally, such an approach would account for the following realities:
- The risk to the device must directly reflect its highest severity finding
- The more findings there are, the higher the aggregate risk score should be
- The severity of ALL findings should be accounted for and reflected in aggregate score
This leads us to the following formula:

The aggregated risk of a device is a function of the number and severity of the vulnerabilities associated with it.
Where:
- F is the number of findings being aggregated into a single score { 0 – }
- H is the highest severity rating of the findings being aggregated { 0 – 10 }
- A is the average severity of the findings being aggregated { 0 – 10 }
Since the number of findings is unbounded, the resulting value cannot be normalized, and is a non-negative rational number.
Interpreting Aggregate CVSS Scores

The interpretation of the aggregate risk score for a network device is simple: the higher the score, the greater the relative risk. The risk score is most meaningful as a device-specific metric, whose reduction directly correlates to improved device security, and whose minimization corresponds to reduced risk.
It is not meaningful to compare scores across devices, as there are multiple factors accounted for in the calculation, and wide variation in those factors (#findings, highest severity, average severity) can potentially be misleading.
Decisions about which servers represent the greatest threat must be based first in the Highest Severity Rating, and secondarily on the Aggregate Score. Both factors are relevant, the latter being most important when the Highest Severity values of multiple devices are very similar.
For example, consider the following device scores:
| Device | # Findings | Highest Severity Rating | Average Severity | Aggregate Risk Score |
| A | 100 | 3.0 | 3.0 | 600 |
| B | 3 | 9.8 | 9.4 | 57.6 |
| C | 5 | 8.7 | 5.5 | 71 |
| D | 37 | 9.6 | 9.4 | 703 |
If we look only at the Highest Severity to guide our work, our remediation priority would be device B, which is potentially the wrong decision as compared to D. If instead we look exclusively at Aggregate Risk Score, we incorrectly make device A priority. Sorting first Highest Severity and then by Aggregate Risk Score allows us to appropriately select device D as warrantying our immediate attention.
Network Aggregate CVSS Scores
Rather than comparing individual device aggregate scores, it is more meaningful to extend the calculation to span multiple devices:
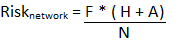
The aggregated risk of a network is a ratio of the number and severity of the vulnerabilities associated with it, to the number of network nodes.
Notice that this formulation has the effect of diluting the importance of the number of findings as the size of the network grows. For example, this reflects the reality that the risk of the 10 findings on a single node is more serious than those same 10 findings in a 100 node network.
Interpreting Network Aggregate CVSS Scores
Once again, the most significant insight provided by the aggregate network score is its use as a progress indicator towards security risk reduction. As the score decreases with remediation, so does the security risk inherent in the associated network.
Another insight that is consistent with device scoring is that decisions about which networks represent the greatest threat must be based first on their Highest Severity Rating, and only secondarily on the Aggregate Score. Both factors are relevant, the latter being most important when Highest Severity findings of multiple networks are very similar.
Tracking Remediation Progress
It is very common to periodically conduct security scans of networks, and in fact, it is a required Regulatory Compliance activity for some industries. Ideally, the overall security risk is being reduced over time, or is being held at some acceptable baseline. Consider the following set of scans of a 145 node network, focusing on how the Aggregate Score in case reflects the associated reduction in risk:
| Scan | #Findings | Highest Severity Rating | Average Severity | Aggregate Network Score |
| 1 | 73 | 8.5 | 6.7 | 7.65 |
| 2 | 47 | 5.0 | 3.9 | 2.88 |
| 3 | 12 | 5.0 | 2.7 | 0.64 |
| 4 | 9 | 3.1 | 2.7 | 0.36 |
Conclusion
Methods for calculating the aggregate value of CVSS scores have been presented for both devices and networks. Aggregate scores have been shown to provide valuable insight in prioritizing remediation, as well as in tracking the progress of security risk reduction.